Variants
The Variants Worksheet helps analyze process complexity, categorize activities, and identify opportunities for harmonization and automation. By examining variant composition, users can assess process homogeneity and the impact of B and C variants, leading to streamlined workflows and improved efficiency.
Type: Dashboard
Key Figures
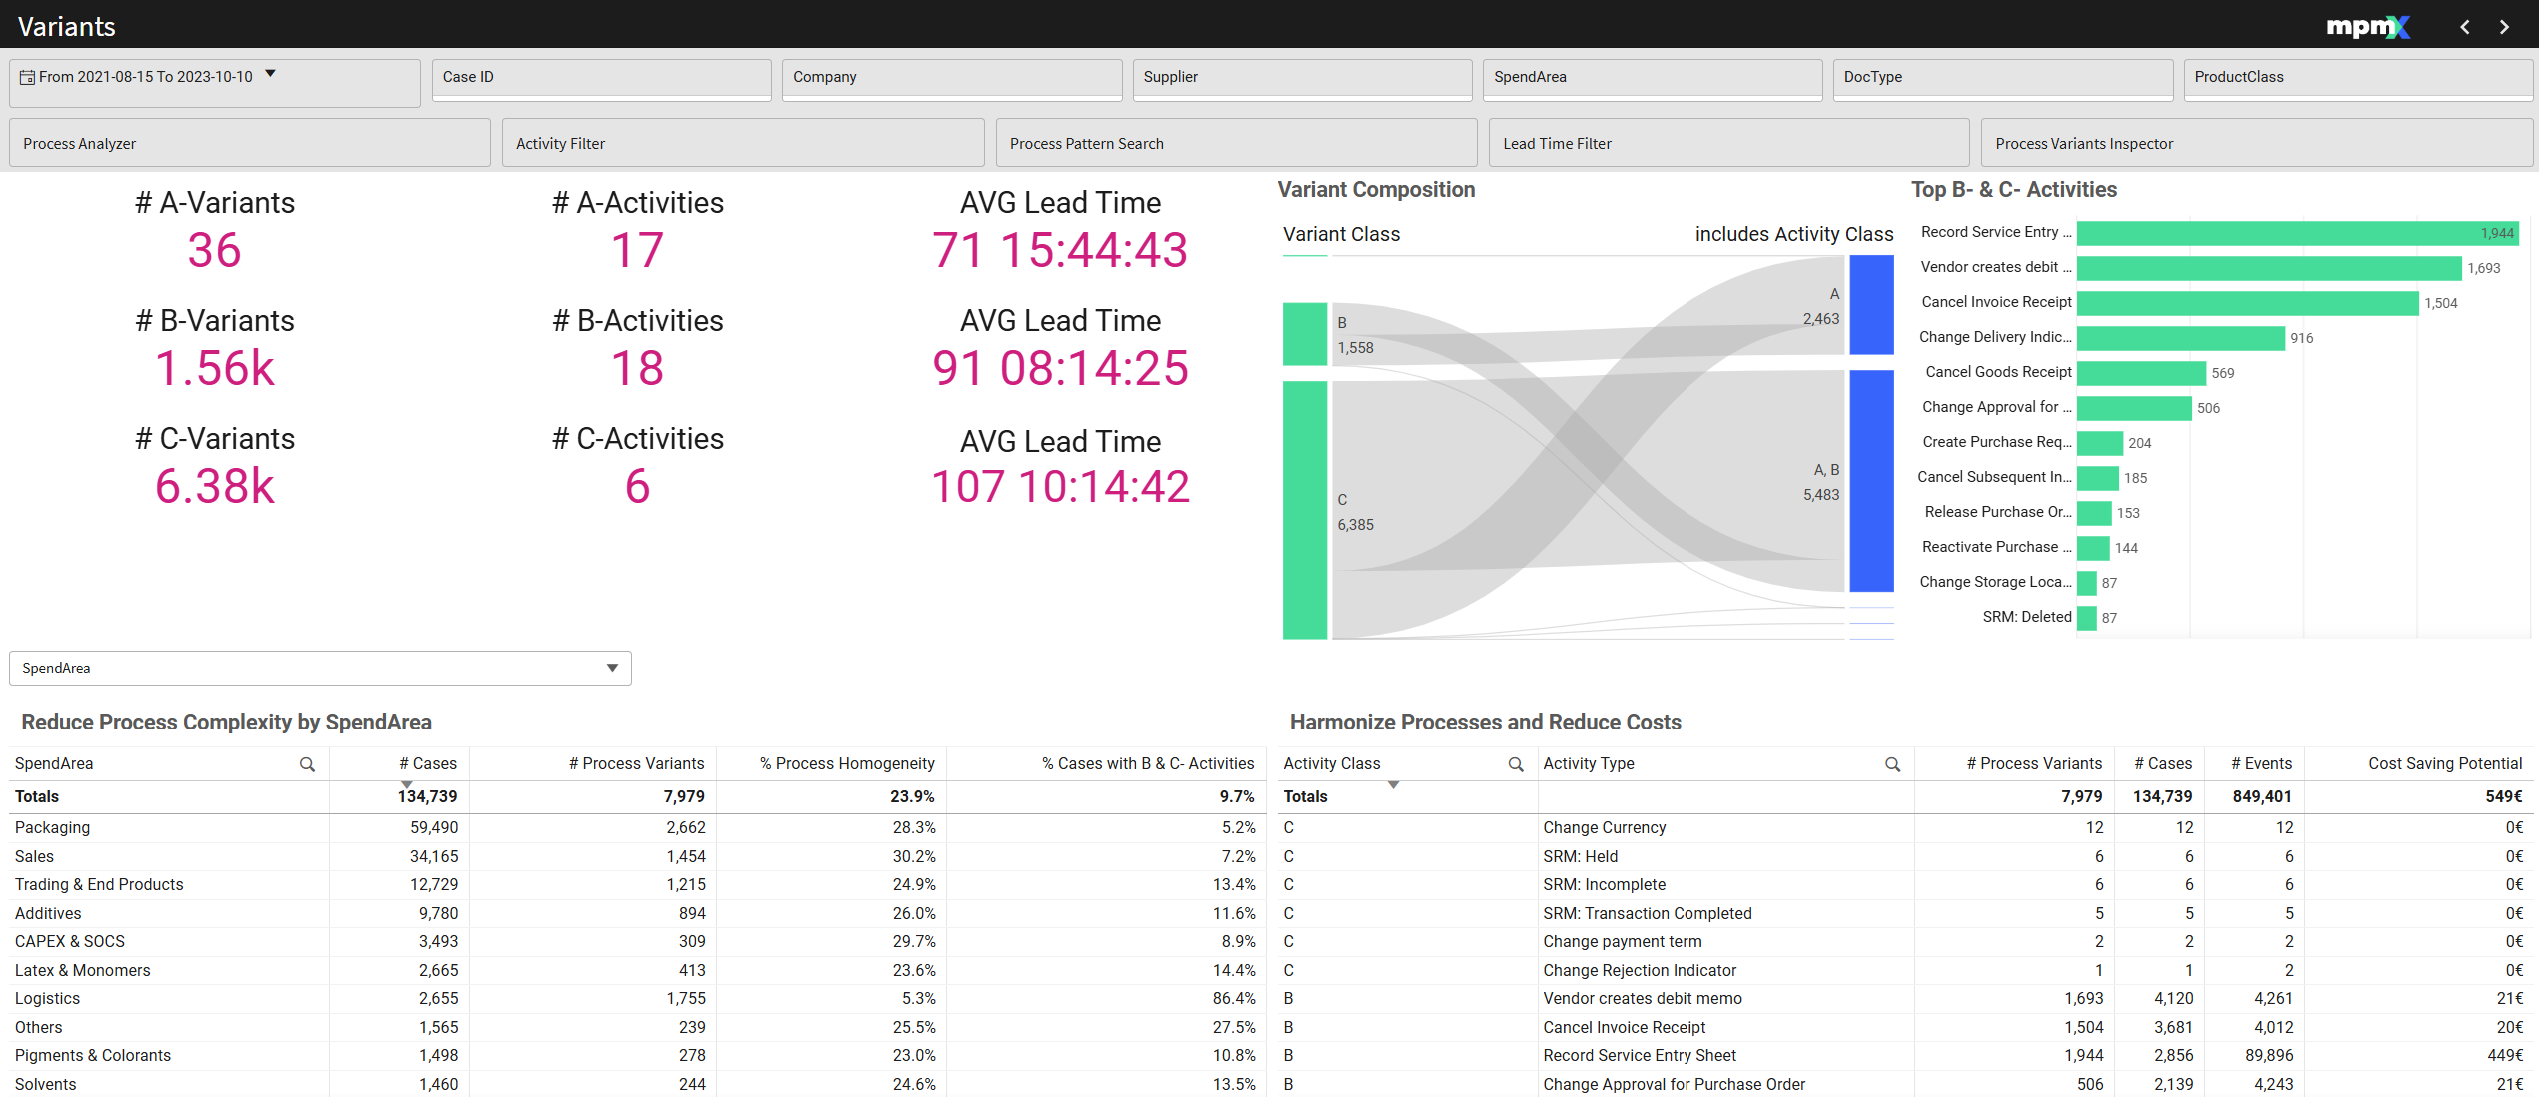
ABC Analysis for Variants
- A-Variants (80%) – The most common process variants, covering 80% of all cases.
- B-Variants (15%) – Variants covering the next 15% (80-95% of cases).
- C-Variants (5%) – The least common variants, covering the last 5% of cases.
- A high number of B and C variants indicates a complex process.
ABC Analysis for Activities
- A-Activities – That appear in A-Variants.
- B-Activities – That appear in B-Variants.
- C-Activities – That appear in C-Variants.
- B and C activities are non-core activities and contribute to complexity.
ABC Analysis for Lead Time
- A-Variant Lead Time – Average completion time for A-variant cases.
- B-Variant Lead Time – Average completion time for B-variant cases.
- C-Variant Lead Time – Average completion time for C-variant cases.
- Reducing variants can shorten lead times by simplifying processes.
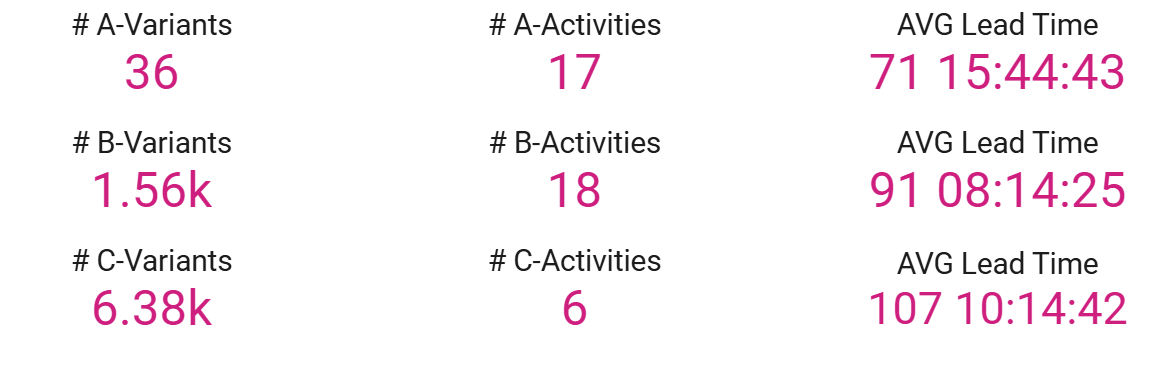
Variant Composition | Chart
- A-Variants – Contain only A-Activities.
- B-Variants – May contain A and B activities or unique sequences.
- C-Variants – Can include A, B, and C activities.
- Reducing B and C activities decreases the number of variants and simplifies processes.
- Use the chart to filter and analyze further by clicking on the Variants.
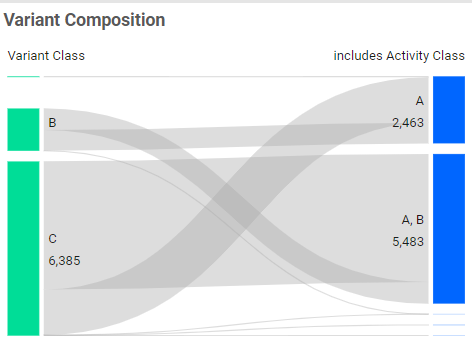
Top B- & C-Activities | Bar Chart
- Displays the most common B and C activities.
- May indicate rework or unnecessary steps that should be minimized.
- Use filters to refine insights and pinpoint areas for improvement.
Reduce Process Complexity by [Dimension] | Table
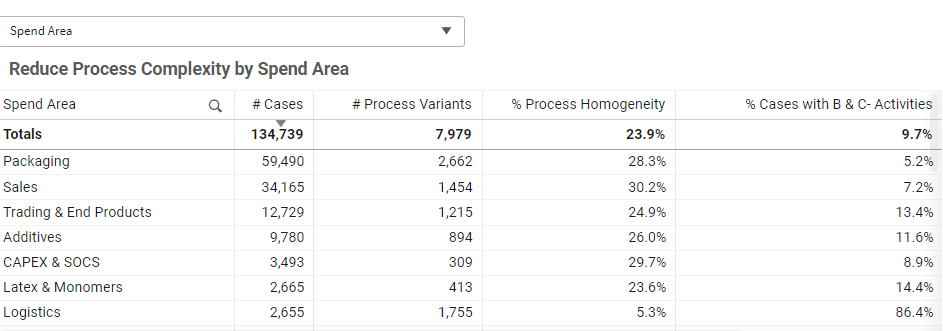
- Dropdown Selection – Choose a dimension (e.g. Product Class) to analyze specific metrics.
- Sorting & Filtering – Identify areas with high case counts or excessive variants.
Key Metrics:
- % Process Homogeneity: Used to measure the consistency and uniformity within a process. The more cases covered by a single variant, the higher the homogeneity percentage. If you have one process variant that covered all the cases for that dimension value, then the process homogeneity would be 100%.
- % Cases with B & C-Activities: This number should be low.
Sort by column to find insights or select in the table to filter further.
Harmonize Processes and Reduce Costs | Table
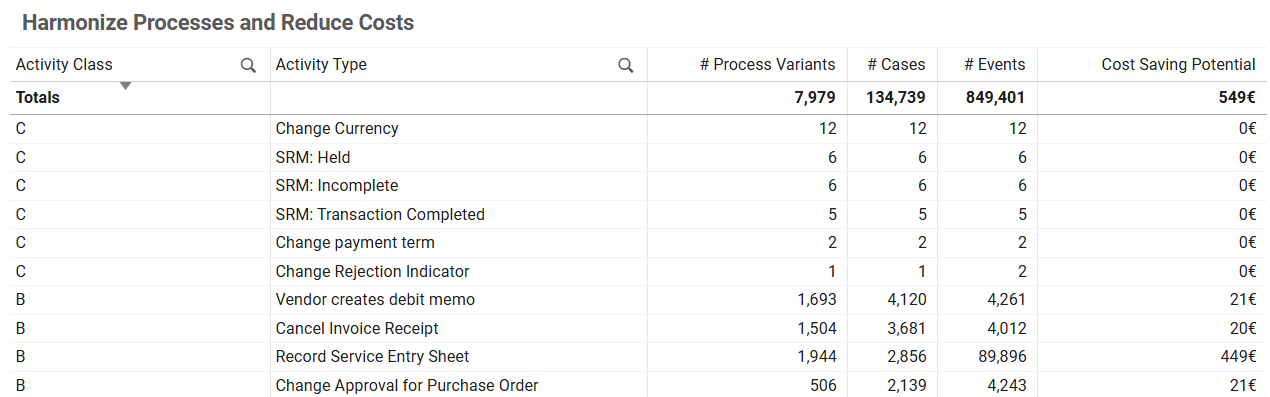
- Sorts activities by A, B, or C classification.
- Focus on undesirable activities that increase complexity.